The power of an infographic
I have written a few posts previously with infographics. I like them. They convey a message in an easy to understand way. Of course, as a management accountant, I would say they may also include some really useful information to help managers (and others) make decisions.
Recently, Dr Stephen Jollands from Exeter sent me this one. It is so clear and it’s message is direct and simple – despite the many complexities within renewables and the environment etc.

US Postal Service – reduced volumes = reduced costs

(Photo credit: Wikipedia)
In February this year, the United States Postal Service (USPS) decided to cease delivering mail on Saturdays. While this may be seen as inconvenient for some personal and business users, in management accounting terms it is probably a simple cost-volume issue.
Mail volumes have fallen globally due to email and other communications media. With falling volumes, a postal service would either have to reduce costs or increase revenues to maintain profits – or keep state subsidies low. Increasing revenues may be difficult given the competition is sectors such as parcel deliveries, which have increased in volumes. It is also difficult to raise postage rates given the political and/or state involvement. So this leave costs, or more specifically cost-cuts, to get things back in balance. Apparently, ceasing Saturday deliveries will save $2 billion annually. You can read more here from The Economist
Cost overruns on projects
Here is a great infographic from the February edition of CIMA’s Financial Management. A few Irish projects in there. I think we’re better nowadays, but I may stand corrected on that.
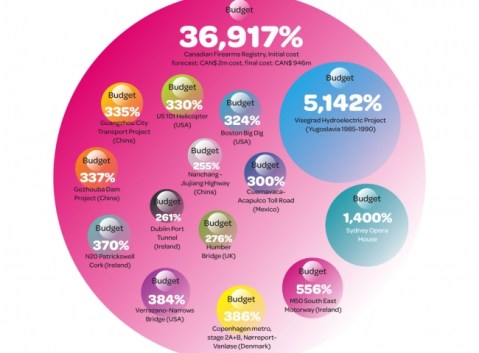
Read the full article at this link:
15 of the world’s biggest cost overrun projects | CIMA Financial Management Magazine.
Money in Formula 1
Following from my last post, I done a little digging around and found a great article in Forbes about the money and brand valuations in the Formula 1 business. Red Bull may the new and hip brand, but Ferrari is viewed as the most valuable. Have a read here

Money in football
A short post today. I am not a big football fan, but when you think of the amounts of money top football clubs earn and spend, it’s big business. The Economist published a great infographic and few months ago which show the revenues if the top European teams. Very interesting – you can see it here

London Underground – profitability and costs in the early days

London underground (Photo credit: @Doug88888)
I have been reading a book recently on the history of the London Underground. It’s called Underground to Anywhere by Stephen Halliday and I actually bought it in the London Transport museum, on Covent Garden. Of course the tube is 150 years old this year, and you will find more about that here.
Reading the book I was quite surprised by how much accounting was in there. Two things stand out from the early days of the tube which related to accounting. First, the financing seemed to be quite precarious. As each line was built by private companies, private finance was raised. And when results proved less than expected, it seems quite a bit of creative re-financing went on. The author actually notes that without the somewhat suspect and complex financing, London’s Underground may not have grown to what it is today.
The second thing was the fares structure in the early days. Before lines were connected, the fares seemed to have been standard at say 2 pence. However, the author notes that the various companies started to raise and lower fares and certain times, or lower fares overall to increase passengers numbers and revenue- a classic cost, volume profit (CVP) scenario.
Fraud at Olympus
Internal controls and fraud are not really an area that I write a lot on. Just before Christmas I read this article from CIMA about fraud at Japanese firm Olympus. It includes interviews with Michael Woodward, who was at the heart of putting things right. The are a lot of issues in the article and it is worth a read.
Big data and (small) accounting software

Last week I wrote about big data in general. Now I will try to give an example of how accounting software used in small business can be a source of big data, which can ultimately help those same businesses.
Quickbooks is a common accounting software product used in many smaller and medium-sized businesses. Traditionally, Quickbooks was installed on a computer in the organisation, but nowadays it is also available as an online product. In other words, there is a cloud version. According to an article in Forbes in April 2012, as much as 35 million of Intuit (the owners of Quickbooks) customers use online software for accounting and tax returns. With anonymous data on 35 million small businesses, Intuit can obtain quite a lot of information for their own purposes in terms of capturing user needs and developing their products. But they are also using this information to assist their customers. One great example cited in the Forbes article is a Trends feature. With this feature, a business owner can compare their business to average performance trends in the same sector, and even with similarly sized businesses. A comparison of sales, operating margins and payroll cost is possible. This kind of information would be really useful for any small business and typically such a business would have neither the time or resources to obtain such data.
What is big data?

Big Data: water wordscape (Photo credit: Marius B)
This post gives you a brief introduction to “big data”, a term used in many circles and in many businesses. The following posts will then give some examples from real business to help you understand the effects this might have on accounting and accountants.
Although the term big data has become mainstream in recent years, it has been used for a decade or more by scientists to simply describe very large amounts of data. Diebold (2003) defines big data as follows:
Big data refers to the explosion of quantity (and sometimes, quality) of available and potentially relevant data, largely the result of recent and unprecedented advances in data recording and storage technology.
It is hard to believe that this definition although only a decade or so old, bears little resemblance to what can be achieved today in terms of data collection. Devices such as smartphones and tablets in a cloud-computing environment allow users to use cloud-based services (such as software or social networks) and, in turn, data can be collected through these devices and stored elsewhere in the cloud. The result is vast potentially vast amount of data, which can be analysed for many purposes, including business decisions. Facebook has about a billion users, there are about 500 million tweets per day sent on Twitter and Google handles about 3 billion search queries per day. These vast uses of each of the mentioned websites/network generates hitherto unknown amounts of data, some of which may be useful, some of which may not. In an article for Forbes, Feinleib notes three issues with big data, which give a good insight into what it is, and the problems facing business:
1) big-data is ill-defined.. We are not sure what exactly big data is, but a Jevons Paradox seems to exist in the world of big data. As technology evolved to allow the storage and analysis of large volumes of data, more data is being stored and analysed by organisations.
2) big data is intimidating. He asks “how do we make big data approachable” from perspectives such as having tools to analyse data, to getting the right insights and information from the data.
3) big data is immediate. Huge volumes of data are generated, but the analytical value of this data can decay rapidly. For example, in the near future companies like Google and Groupon may display adverts on mobile devices for businesses in the immediate proximity of a consumer – the time to analyse and act on this data could be a matter of minutes, or even seconds.
References:
Diebold, F. 2003, “ ‘Big Data’ Dynamic Factor Models for Macroeconomic Measurement and Forecasting” (Discussion of Reichlin and Watson papers), in M. Dewatripont, L.P. Hansen and S.Turnovsky (eds.), Advances in Economics and Econometrics, Eighth World Congress of the Econometric Society. Cambridge: Cambridge University Press, 115-122.
What does ‘cost’ mean?
If we look at a management accounting text book such as the one by Burns et al (self promotion, sorry), the term cost is defined as follows:
“the monetary value of the resources forgone or sacrificed in order to achieve a specific objective such as acquiring a good or service”
And, if we continue to read their chapter on costs (or indeed a similar chapter in any other management accounting text) we’ll find that costs can be classified in many ways – fixed, variable, mixed, product, period, relevant are just some classifications commonly used. I recently watched two documentaries on BBC television which portrayed the different meanings and uses of the word cost. I’ll summarise them below.

The first example is from a documentary called Inside Claridge’s – Claridge’s is a up-market hotel in London. In the episode I watched, the hotel was being decorated for Christmas. The decorations inside and out were quite fabulous, and the Christmas tree was commissioned from a custom designer. The programme narrator asked the hotel manager how much the decorating cost. His reply: “How much does magic cost”. A great answer I thought. To try to convert this to management accounting speak, I would translate the answer as “That’s not a relevant cost, the decision is made”.

Fault (Photo credit: orkybash)
The second example was a documentary on BBC Four on living near an earthquake zone or fault lines. One seismologist spoke about a complex underground monitoring system, which could sense earthquake vibrations and give warnings (via sirens or signs) to residents in cities like Los Angeles and San Diego. The system would cost in excess of $100 million, and give enough time to do things like shut down nuclear reactors or close-up an open wound on a hospital operating table (the seismologist’s words, not mine). I was thinking $100 million, that’s a lot. The seismologist then quickly noted that the economic output of California is in the order of $200 billion per annum. This makes the cost look a lot smaller, given that large earthquakes probably are a once in a lifetime event.
Some quotes about accounting

For the fun, I decided to do a search of some websites who provide famous quotes for this post. I searched using simply the word “accounting” and here are a few of the results. Enjoy.
Mark-to-market accounting is like crack. Don’t do it.
I have made the tough decisions, always with an eye toward the bottom line. Perhaps it’s time America was run like a business.
I never get the accountants in before I start up a business. It’s done on gut feeling, especially if I can see that they are taking the mickey out of the consumer.
20 years of balanced scorecards
The balanced scorecard was 20 years old in 2012. Here is link to a video from CGMA where the original scorecard creators, Kaplan and Norton, reflect on the last two decades.
Kindle Fire breaks even – but profits elsewhere

Image via CrunchBase
I have written a few posts before on breakeven, but here is a great example of how businesses are prepared to accept not making money on some products, for the sake of others. In October 2012, Amazon launched its Kindle Fire tablet and its Paperwhite e-reader in the UK and other European countries. The Kindle Fire retails at about £150, which is probably less than half the price of an iPad and about £100 cheaper than an iPad mini. In an interview with the BBC , Amazon’s boss Jeff Bezos said the company sells its hardware at cost i.e. they breakeven. This may explain the cheaper price of the Kindle Fire compared to the iPad. However Amazon earn profits on Kindle book sales, Kindle book rentals and its Prime service. In contrast, Apple have noted they breakeven on services such as iTunes and make profits on their hardware,
The learning curve – real life application

I have previously written about the learning curve and its use in management accounting practice. The learning curve effect refers to a possible tendency for tasks to be performed quicker as employees learn them and become more efficient. Thus, over time, costs may decrease. The term experience curve is also used to describe this effect – have a look at the previous post for detail on how to calculate the learning curve effect.
In October 2012, CIMA reported some research on two cases of actual use of the learning curve. The full details can be found here , but I will summarise them briefly here. Pricing was a key issue for one case, so they used the learning curve in their cost and pricing calculations to ensure they were giving customers the most competitive price. In the second case, the learning curve effect was used in investment evaluation to obtain the best future cash flow projections.
A brief (but incomplete) overview of current attempts to account for sustainability : guest post 2 by Dr Stephen Jollands

World map of countries by ecological footprint (Photo credit: Wikipedia)
Guest post #2 by Dr Stephen Jollands
In the previous post I defined sustainability as humanity not over-consuming the resources available to them and thereby irreversibly depleting the levels of natural capital while at the same time ensuring an equitable and fair distribution, both within the current generation as well as across all future generations, of the resources available. The aim of this post is to review some of the tools that claim to account for sustainability and question how well they stack up against this definition.
The obvious place to start is with the very tool we utilised to help explain sustainability, the ecological footprint. This calculates the biologically productive surface area required to sustain the thing of interest; whether that is the Earth, a specific country, an organisation, or even a specific project. Thus this tool is a very effective indicator of resource throughput. Despite being a very effective tool and adhering to a strong conception of sustainability it also has inherent weaknesses. Primarily amongst these is that it gives no indication over the health of the specific part of the ecosphere that the resources are being drawn from or the waste assimilated to. Therefore, it would appear that its effectiveness would be improved if set within a system of supporting sustainability focused management controls. We shall now turn to examining a few of these potential candidates.
The most obvious to examine next is the various types of external reporting that organisations do under the label of sustainability. There have been many differing frameworks developed in this respect including The Prince’s Accounting for Sustainability Project, the GRI and Integrated Reporting. These provide useful tools for businesses to organise their communications with their shareholders in regards to their social and environmental impacts. But this is also the source of critique for them as well. That is we have to question how far beyond public relations these reports go. The proponents of the various framework argue that the use of their frameworks provide stakeholders with an in depth analysis of the social and environmental impacts of an organisation. However, we need to question whether any rationale executive would allow the more controversial elements of their operations to be released in a public environment. When we reflect on the various accounting standards inability to provide clarity over economic affairs, as is evidenced by continual scandals, it is hardly surprising that these frameworks will probably fare no better. Further, none of these frameworks requires the organisation to report on the scale or scope of resources drawn from the ecosphere or waste assimilated back into it (i.e. an ecological footprint), which, as was explained last week, is at the heart of the issue of sustainability. This is not surprising as the accounting entity convention sets precise limits as to what is accounted for. For this very reason many commentators have expressed the view that the focus of the going concern concept should be elements of the ecosphere; such as rivers and forests; rather than the economic entity. If this was the case then economic organisations would be required to account for how they have helped maintained these ecosphere going concerns and in doing so been allowed to generate a profit.
The final example, although there is so many others we could review, which I will cover will be attempts to provide a cost to the social and environmental impacts of an organisation. The reason for selecting this as the final example is that Puma generated a large amount of publicity recently through publishing their first Environmental Profit and Loss account. Puma reports that their environmental impact for the key areas of greenhouse gas emissions, water use, land use, air pollution and waste, generated through their operations and supply chain is valued at €145 million in 2010. In the same year Puma reported that their Net Earnings were €202.2 million. This raises the question as to whether, given their Net Earnings were greater than their environmental impacts, they are therefore a truly sustainable organisation? The possibility of one of the world’s most notable examples of a consumerism driven, profit increasing through growth in sales organisations being sustainable seems to fly in the face of the evidence provided by the ecological footprint of our current over consumption of natural capital. This contradiction could be better explored had Puma provided more in depth details surrounding their calculations. However, given the involvement of consultants in this calculation, these details are unlikely to be ever released. The final question to ask is what concrete actions will this calculation result in?
In closing this quick overview, I would also question why Puma chose to put itself in a position for stakeholders to believe that it was the first organisation to provide an environmental profit and loss account when so many other notable and more transparent examples and experiments have occurred before? Or indeed we could question why Puma did not utilise one of these other tools given they are existing technologies and these tools have a close relationship with strong conceptions of sustainability? One notable example is full cost accounting (FCA). FCA as a concept integrates all potential costs and benefits, including those that relate to social and environmental, that organisations would normally consider as externalities, into the economic calculations they perform. The aim, therefore, is to ensure that a full set of broad considerations are taken into account during the decision making process. Of course here the emphasis is on decision making rather than releasing information publically and hence when this tool is used it generally does not make levels of publicity anywhere near those generated by Puma. Related to this is the sustainability assessment model (SAM), which is a tool developed in order to assist with the implementation of FCA. It is interesting that a colleague of mine focused his PhD research on assisting two local government bodies in implementing the use of SAM. While one of these were genuinely amazed at the extent of their impact and proceeded to take action accordingly, the other asked my colleague to leave when the SAM failed to deliver the “right” answer. That is when it provided visibility over the high levels of un-sustainability this plainly was unsettling to the managers involved. It is often understood by researchers in the area of accounting for sustainability that if the results do not make you feel incredibly uncomfortable you’re plainly not doing it right. Thus it is with interest that I introduce the last tool, the sustainable cost calculation (SCC). SCC is a way to measures how much it would cost an organisation to ensure that its operations left Earth at least no worse off at the end of the accounting period. The idea here is precisely to utilise the language of accounting to provide visibility over the true impacts of an organisation on natural capital and thereby the gapping chasm between our current operations and those that would be sustainable. It is interesting that the experiments with this tool have, beyond showing the un-sustainability of the organisations involved, highlighted how difficult it is to perform these calculations given the complexities and our relative dearth of knowledge as to how our ecosphere works.
The point I am trying to highlight in this post is that it is hard to be anything but cynical of many of the current attempts to account for sustainability as they do not link to the underlying issues and appear to be nothing more than attempts to generate publicity for the organisations involved.
These issues, covered in these two posts, around accounting and sustainability is the focus of my research and teaching efforts:
http://business-school.exeter.ac.uk/about/whoswho/index.php?web_id=Stephen_Jollands&tab=profile
I would therefore encourage anyone interested in furthering their knowledge in the area of sustainability and business to consider undertaking the innovative One Planet MBA, which I teach the accounting module in:


