Some insights from IAG
 IAG, or the International Airlines Group, is the the parent of Aer Lingus, British Airways and Iberia. In my university, we were lucky enough to have their CEO, Willie Walsh, speak to us before Christmas.
Some things he mentioned are relevant to this blog, and of course interesting. One thing Mr Walsh noted was how only in recent years has the airline sector actually made a return on capital. This must be attributable in some way to a focus on cost by the sector in recent years. The chart below from IATA shows what I mean. As you can see, the cost of capital was higher than the return until 2014.
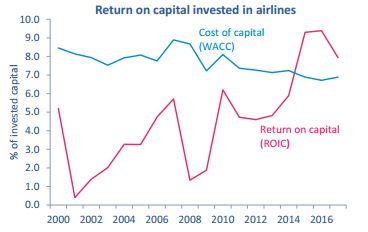
As my last post indicated, a focus on cost and efficiency has been a feature of the airline sector in recent years. To give another example, Mr Walsh cited an example of using two larger aircraft on a route without a loss in passenger capacity. So fuel, crew and capital cost all decrease in such a scenario. In addition, it freed up a slot at London’s Heathrow airport, which can then be used to generate more revenues.
What is wrong with this headline “Tesco delayed payments to suppliers and boosted profits”

Image from journal.ie
So what is wrong with above statement? Simply, it is the application of the accruals concept in accounting. Under this concept, revenues and expenses are matched, and when cash is received/paid is not relevant – at least in the calculation of profit.
Here is a simple example. Let’s assume a business sells goods for $1,000 cash but has not paid the supplier. The goods cost $600. The profit on this is $400. If the supplier is never paid, or is paid in 10 days, the profit will not change.
While the article is incorrect in terms of the title, it’s message is solid – that you can benefit by not paying people. In the simple example above, the business has $1000 in the bank.
The versatility of gross profit margin

You may know the gross profit margin ratio, which is:
Gross Profit x 100
Sales.
Gross profit is: Sales – Cost of Sales
and
Cost of Sales = Opening inventory + Purchases/cost of production – Closing Inventory.
In this short post I would just like to share some of my experiences on the versatility of this simple ratio. If we look at the elements of the ratio, it is easy to see that if each element remain stable, the answer should also be stable. So for example, if I buy something for €40, sell it for €100, then my GP margin is 60%. If my sales price or purchase price changes, then the GP margin changes. Then, if we think about inventory levels, if these fluctuate the GP margin changes too. Taking all this together, it’s easy enough to see how any business typically knows what its GP margin should be. Thus, if it varies considerably, there may be something wrong.
Here are two things I know the GP margin is used for. One, from my own experience, is in pubs/bars. Most pubs/bars are susceptible to fraud and controls typically put in place by owners. One such control is monthly stock-takes and monthly accounts. A fall in the GP margin could indicate “lost” stock or unrecorded cash receipts – which further controls may reveal. Another use is to spot inflated revenues. Businesses may want to make their profits look better and thus do things like invoice for goods early, before the end of a financial year. These good may not even be bought/made yet. Thus, the GP margin may be lower. Again further investigation is needed to find the issue.
There may of course be more simple reasons for changes in the GP margin – costs and sales prices may simply change and affect the ratio. But once these have been ruled out, it is a useful indicator.
What’s the cost of Christmas?
Ask any parent and they will tell you a lot! Given the time of year, have a look at this article which looks at the costs of the 12 gifts in the “12 Days of Christmas” song we all know.
Have a great Christmas!
What is lean accounting?
Defining lean accounting is a bit odd to me, as I don’t really buy the idea that there is a technique called “lean accounting”. Having said that, there is definitely a concept called lean manufacturing. In a nutshell, lean manufacturing implies three concepts – pull, flow and waste reduction. Pull means product is produced (or pulled) according to customer demand. Flow means product moves through a facility as efficiently as possible and no delays. Both of these should imply waste reduction.
So what does this mean for accounting. Well one thing is inventory reduction. Another may be capital investment to get things working well. Both might put accountants off! But rather than me rattle on, here is a very nice article from Forbes which explains lean accounting and some issues.
Non-financial performance measures – example of one difficulty from Deutsche Bahn

According to a report in Der Spiegel, German rail company Deutsche Bahn has had quite an increase in the volume of customer complaints last year (2013). Complaints reached a new record in fact and were 50% higher than previous years.
For a rail company, customer complaints are probably one key non-financial performance measure. Ideally, the complaints should be as low as possible and I am sure a there’s a target in Deutsche Bahn on this measure. Reading the report though, it’s easy to see why using non-financial performance metrics can be tricky. Apparently the increase is down to ow things. First, more complaints arose due to poor weather – something beyond anyone’s control. And second, a new system for customers made it easier to complain. So, a simple year on year comparison of customer complaints would be quite useless. Maybe even setting a target is tricky too, as weather, strikes and many other non-controllable factors could come into play.
Despite such difficulties with non-financial measures, they will always augment monetary measures. While money is typically quite a stable measure , it can’t capture qualitative factors like customer satisfaction.
The AK 47 – a good example of production and cost standards

(Photo from Kalashnikov Muesum)
On December 23 last, Mikhail Kalashnikov the designer of the infamous AK 47 machine rifle died. I had some thoughts about the AK 47 which led me to write this post. But before I convey my thoughts, let me say that I am not trying to glorify one of the world’s most lethal assault weapons, nor do I condone violence.
As a child who grew up in Ireland, I knew at a young age what a Kalashnikov was. In the 1980’s it was the favoured weapon of the IRA and I had seen images of it on TV news reports. I also remember the news reports saying it was favoured for its simplicity and ease of repair.
So, when Kalashnikov died last year, I started thinking about how the AK 47 was made. It has been made (with a few variants, such as the lower cost AKM) since 1947, and is still in production. It has a simple gas mechanism, few parts and lots of space between the parts.
The manufacture is thus relatively simple, and as it seems to have not changed much since the 1940’s, this may be one of the best examples I could think of in terms of standards as used in standard costing. With 70 years of production history, I would guess that there are standard times for assembly of the various components of the AK 47. And, production planning based on such a long experience of making pretty much the same thing is likely to be quiet simple. Simple design, standard times and good planning of course contribute to lower cost – and my reading around on the AK 47 has revealed that keeping costs down was one design goal. So, I guess it comes as no surprise with its efficient design and production, that the AK 47 is cited as a weapon responsible for more deaths than any other. Not the main point if this article of course, but I hope you get the link to standard costing techniques.
Here’s a good related article from The Economist.
What is throughput accounting?
Throughput accounting is an alternative to traditional internal cost reporting. It stems from the Theory of Constraints, which I won’t detail here, but essentially this theory suggests an organisational can best achieve its goals (e.g. profit) by maximising it use of a constraining resource. A constraint could be machine capacity for example, and by maximising throughput on the constraint profit is maximised. To report on throughput, a new accounting approach is required, called throughput accounting:
1) Totally variable costs – this means a cost which is incurred only when a product/service is created. This often means only material costs. Labour costs are not totally variable, as employees are typically paid regardless. Some transportation or subcontracting costs may be totally variable. All overhead costs are not totally variable.
2) Throughput – this refers to revenue less totally variable costs. Contribution using throughput accounting is likely to be higher.
3) Operating expenses – this refers to all costs other than totally variable costs. Operating expenses are not distinguished into categories such as fixed or variable, or allocated to products in any way i.e they are similar to period costs, as they are costs which are more
associated with the passage of time than with products.
4) Net profit – in throughput accounting, the net profit is simply throughput minus operating expenses.
Looking at 1-4 above, you can see no attempt is made to allocate any overhead cost, so throughput accounting does not meet normal GAAP requirements. It does however raise the possibility of selling products/services at a price which is lower than under normal cost accounting, and it may also be useful for short-term decision making. Below is an example of a profit statements from Burns et al (2013. p. 112), which shows how throughput accounting produces a differing view on costing.
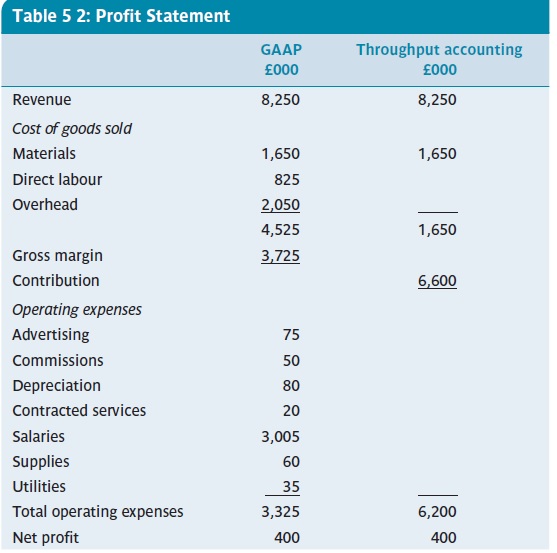
The overall net profit figure is exactly the same, but you can see a much bigger contribution under the throughput method. Arguably, as only material costs (in this example) are totally variable, a report such as the one above is very useful for short term decision-making.
References:
Management Accounting, Burns,Quinn, Warren & Oliveira, McGraw-Hill, 2013 – see burnsetal.com
The power of an infographic
I have written a few posts previously with infographics. I like them. They convey a message in an easy to understand way. Of course, as a management accountant, I would say they may also include some really useful information to help managers (and others) make decisions.
Recently, Dr Stephen Jollands from Exeter sent me this one. It is so clear and it’s message is direct and simple – despite the many complexities within renewables and the environment etc.

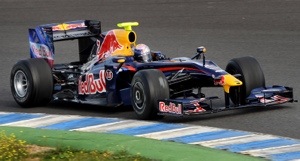
Money in Formula 1
Following from my last post, I done a little digging around and found a great article in Forbes about the money and brand valuations in the Formula 1 business. Red Bull may the new and hip brand, but Ferrari is viewed as the most valuable. Have a read here
Money in football
A short post today. I am not a big football fan, but when you think of the amounts of money top football clubs earn and spend, it’s big business. The Economist published a great infographic and few months ago which show the revenues if the top European teams. Very interesting – you can see it here

20 years of balanced scorecards
The balanced scorecard was 20 years old in 2012. Here is link to a video from CGMA where the original scorecard creators, Kaplan and Norton, reflect on the last two decades.
A brief (but incomplete) overview of current attempts to account for sustainability : guest post 2 by Dr Stephen Jollands

World map of countries by ecological footprint (Photo credit: Wikipedia)
Guest post #2 by Dr Stephen Jollands
In the previous post I defined sustainability as humanity not over-consuming the resources available to them and thereby irreversibly depleting the levels of natural capital while at the same time ensuring an equitable and fair distribution, both within the current generation as well as across all future generations, of the resources available. The aim of this post is to review some of the tools that claim to account for sustainability and question how well they stack up against this definition.
The obvious place to start is with the very tool we utilised to help explain sustainability, the ecological footprint. This calculates the biologically productive surface area required to sustain the thing of interest; whether that is the Earth, a specific country, an organisation, or even a specific project. Thus this tool is a very effective indicator of resource throughput. Despite being a very effective tool and adhering to a strong conception of sustainability it also has inherent weaknesses. Primarily amongst these is that it gives no indication over the health of the specific part of the ecosphere that the resources are being drawn from or the waste assimilated to. Therefore, it would appear that its effectiveness would be improved if set within a system of supporting sustainability focused management controls. We shall now turn to examining a few of these potential candidates.
The most obvious to examine next is the various types of external reporting that organisations do under the label of sustainability. There have been many differing frameworks developed in this respect including The Prince’s Accounting for Sustainability Project, the GRI and Integrated Reporting. These provide useful tools for businesses to organise their communications with their shareholders in regards to their social and environmental impacts. But this is also the source of critique for them as well. That is we have to question how far beyond public relations these reports go. The proponents of the various framework argue that the use of their frameworks provide stakeholders with an in depth analysis of the social and environmental impacts of an organisation. However, we need to question whether any rationale executive would allow the more controversial elements of their operations to be released in a public environment. When we reflect on the various accounting standards inability to provide clarity over economic affairs, as is evidenced by continual scandals, it is hardly surprising that these frameworks will probably fare no better. Further, none of these frameworks requires the organisation to report on the scale or scope of resources drawn from the ecosphere or waste assimilated back into it (i.e. an ecological footprint), which, as was explained last week, is at the heart of the issue of sustainability. This is not surprising as the accounting entity convention sets precise limits as to what is accounted for. For this very reason many commentators have expressed the view that the focus of the going concern concept should be elements of the ecosphere; such as rivers and forests; rather than the economic entity. If this was the case then economic organisations would be required to account for how they have helped maintained these ecosphere going concerns and in doing so been allowed to generate a profit.
The final example, although there is so many others we could review, which I will cover will be attempts to provide a cost to the social and environmental impacts of an organisation. The reason for selecting this as the final example is that Puma generated a large amount of publicity recently through publishing their first Environmental Profit and Loss account. Puma reports that their environmental impact for the key areas of greenhouse gas emissions, water use, land use, air pollution and waste, generated through their operations and supply chain is valued at €145 million in 2010. In the same year Puma reported that their Net Earnings were €202.2 million. This raises the question as to whether, given their Net Earnings were greater than their environmental impacts, they are therefore a truly sustainable organisation? The possibility of one of the world’s most notable examples of a consumerism driven, profit increasing through growth in sales organisations being sustainable seems to fly in the face of the evidence provided by the ecological footprint of our current over consumption of natural capital. This contradiction could be better explored had Puma provided more in depth details surrounding their calculations. However, given the involvement of consultants in this calculation, these details are unlikely to be ever released. The final question to ask is what concrete actions will this calculation result in?
In closing this quick overview, I would also question why Puma chose to put itself in a position for stakeholders to believe that it was the first organisation to provide an environmental profit and loss account when so many other notable and more transparent examples and experiments have occurred before? Or indeed we could question why Puma did not utilise one of these other tools given they are existing technologies and these tools have a close relationship with strong conceptions of sustainability? One notable example is full cost accounting (FCA). FCA as a concept integrates all potential costs and benefits, including those that relate to social and environmental, that organisations would normally consider as externalities, into the economic calculations they perform. The aim, therefore, is to ensure that a full set of broad considerations are taken into account during the decision making process. Of course here the emphasis is on decision making rather than releasing information publically and hence when this tool is used it generally does not make levels of publicity anywhere near those generated by Puma. Related to this is the sustainability assessment model (SAM), which is a tool developed in order to assist with the implementation of FCA. It is interesting that a colleague of mine focused his PhD research on assisting two local government bodies in implementing the use of SAM. While one of these were genuinely amazed at the extent of their impact and proceeded to take action accordingly, the other asked my colleague to leave when the SAM failed to deliver the “right” answer. That is when it provided visibility over the high levels of un-sustainability this plainly was unsettling to the managers involved. It is often understood by researchers in the area of accounting for sustainability that if the results do not make you feel incredibly uncomfortable you’re plainly not doing it right. Thus it is with interest that I introduce the last tool, the sustainable cost calculation (SCC). SCC is a way to measures how much it would cost an organisation to ensure that its operations left Earth at least no worse off at the end of the accounting period. The idea here is precisely to utilise the language of accounting to provide visibility over the true impacts of an organisation on natural capital and thereby the gapping chasm between our current operations and those that would be sustainable. It is interesting that the experiments with this tool have, beyond showing the un-sustainability of the organisations involved, highlighted how difficult it is to perform these calculations given the complexities and our relative dearth of knowledge as to how our ecosphere works.
The point I am trying to highlight in this post is that it is hard to be anything but cynical of many of the current attempts to account for sustainability as they do not link to the underlying issues and appear to be nothing more than attempts to generate publicity for the organisations involved.
These issues, covered in these two posts, around accounting and sustainability is the focus of my research and teaching efforts:
http://business-school.exeter.ac.uk/about/whoswho/index.php?web_id=Stephen_Jollands&tab=profile
I would therefore encourage anyone interested in furthering their knowledge in the area of sustainability and business to consider undertaking the innovative One Planet MBA, which I teach the accounting module in:
A graphical look at business performance – Apple Retail stores
I have written quite a few posts on performance management of firms and how management accountants can use both financial and non-financial performance measures. One thing I have not thus far mentioned is the actual presentation of such information. I am not one of those people who uses the bells and whistles and products like Powerpoint, but I do appreciate that information presenting in a short, concise format. One way to do present information in a clear way is to use a graphical format. So, here I give a great example which a kind reader of my blog referred me to.
We all know how successful Apple Inc are. Now you can look into their annual reports and analysts presentations to get a view of how much money they make. But wouldn’t you love to know what Apple’s managers get to see on a regular basis in terms of the company performance. That is, what kind of performance measurements might they use and report on internally. Below you’ll see a great infographic on the performance of Apple’s retail stores. The data shown is self-explanatory, so I will not detail it here. When I first saw this graphic, I thought wow, wouldn’t this be a great internal performance measurement tool. Of course, we don’t know if Apple actually prepare something like this infographic, but it is certainly quite effective at getting the message across.

From onlinemba.com, see http://www.onlinemba.com/blog/apple-stores/
Integrated reporting
Some recent items in the CGMA magazine summarise some of the features and issues with integrated corporate reporting. Integrated corporate reporting means reporting means more than just reporting the traditional financial/economic type reports to shareholders. Instead, an integrated reporting approach considers social, economic and environmental factors. In the longer term, it can be argued that if firms ignore the environment and society, then firm itself may not be sustainable.
Ideally, a business should be able to prepare a single report which shows now only the typically legally required financial reports, but also how its financial performance affects society and the environment. Some global companies are already doing this. For example, PUMA publishes and environmental profit and loss which values its impacts in terms of resource usages (see here). The CGMA has embarked on an integrated reporting pilot programme over the next two years. They asked an investor, accounts preparer and an integrated reporting advocate for their views. They make for some interesting reading – click on the links to read more. One of the key points emerging is not the difficulties faced in preparing the report or getting the information. Instead, trying to introduce more non-financial data without increasing the information loads (mainly legally driven) given to investors is a great challenge.


