What is throughput accounting?
Throughput accounting is an alternative to traditional internal cost reporting. It stems from the Theory of Constraints, which I won’t detail here, but essentially this theory suggests an organisational can best achieve its goals (e.g. profit) by maximising it use of a constraining resource. A constraint could be machine capacity for example, and by maximising throughput on the constraint profit is maximised. To report on throughput, a new accounting approach is required, called throughput accounting:
1) Totally variable costs – this means a cost which is incurred only when a product/service is created. This often means only material costs. Labour costs are not totally variable, as employees are typically paid regardless. Some transportation or subcontracting costs may be totally variable. All overhead costs are not totally variable.
2) Throughput – this refers to revenue less totally variable costs. Contribution using throughput accounting is likely to be higher.
3) Operating expenses – this refers to all costs other than totally variable costs. Operating expenses are not distinguished into categories such as fixed or variable, or allocated to products in any way i.e they are similar to period costs, as they are costs which are more
associated with the passage of time than with products.
4) Net profit – in throughput accounting, the net profit is simply throughput minus operating expenses.
Looking at 1-4 above, you can see no attempt is made to allocate any overhead cost, so throughput accounting does not meet normal GAAP requirements. It does however raise the possibility of selling products/services at a price which is lower than under normal cost accounting, and it may also be useful for short-term decision making. Below is an example of a profit statements from Burns et al (2013. p. 112), which shows how throughput accounting produces a differing view on costing.
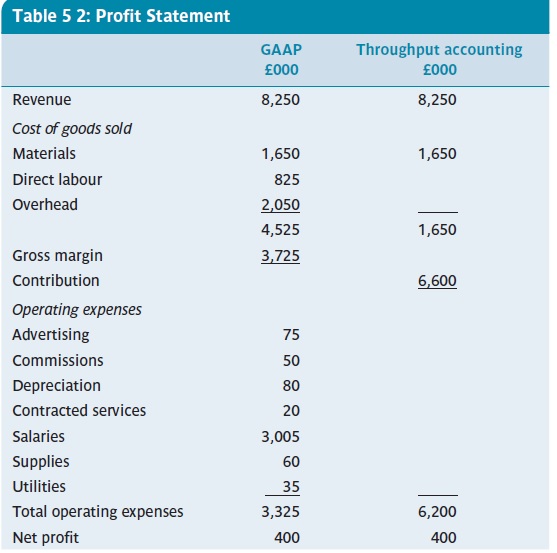
The overall net profit figure is exactly the same, but you can see a much bigger contribution under the throughput method. Arguably, as only material costs (in this example) are totally variable, a report such as the one above is very useful for short term decision-making.
References:
Management Accounting, Burns,Quinn, Warren & Oliveira, McGraw-Hill, 2013 – see burnsetal.com
The power of an infographic
I have written a few posts previously with infographics. I like them. They convey a message in an easy to understand way. Of course, as a management accountant, I would say they may also include some really useful information to help managers (and others) make decisions.
Recently, Dr Stephen Jollands from Exeter sent me this one. It is so clear and it’s message is direct and simple – despite the many complexities within renewables and the environment etc.

Big data and (small) accounting software

Last week I wrote about big data in general. Now I will try to give an example of how accounting software used in small business can be a source of big data, which can ultimately help those same businesses.
Quickbooks is a common accounting software product used in many smaller and medium-sized businesses. Traditionally, Quickbooks was installed on a computer in the organisation, but nowadays it is also available as an online product. In other words, there is a cloud version. According to an article in Forbes in April 2012, as much as 35 million of Intuit (the owners of Quickbooks) customers use online software for accounting and tax returns. With anonymous data on 35 million small businesses, Intuit can obtain quite a lot of information for their own purposes in terms of capturing user needs and developing their products. But they are also using this information to assist their customers. One great example cited in the Forbes article is a Trends feature. With this feature, a business owner can compare their business to average performance trends in the same sector, and even with similarly sized businesses. A comparison of sales, operating margins and payroll cost is possible. This kind of information would be really useful for any small business and typically such a business would have neither the time or resources to obtain such data.
Integrated reporting
Some recent items in the CGMA magazine summarise some of the features and issues with integrated corporate reporting. Integrated corporate reporting means reporting means more than just reporting the traditional financial/economic type reports to shareholders. Instead, an integrated reporting approach considers social, economic and environmental factors. In the longer term, it can be argued that if firms ignore the environment and society, then firm itself may not be sustainable.
Ideally, a business should be able to prepare a single report which shows now only the typically legally required financial reports, but also how its financial performance affects society and the environment. Some global companies are already doing this. For example, PUMA publishes and environmental profit and loss which values its impacts in terms of resource usages (see here). The CGMA has embarked on an integrated reporting pilot programme over the next two years. They asked an investor, accounts preparer and an integrated reporting advocate for their views. They make for some interesting reading – click on the links to read more. One of the key points emerging is not the difficulties faced in preparing the report or getting the information. Instead, trying to introduce more non-financial data without increasing the information loads (mainly legally driven) given to investors is a great challenge.
More responsive corporate reporting?
 CIMA’s e-zine (June, 2011) suggests a more responsive corporate reporting system is need for organisations. The report by CIMA, PwC and a think-tank called Tomorrow’s Company suggests that an evolving reporting system is necessary to reduce risk within organisations and meet the changing needs to both organisations and society. From from brief reading of the report, a central argument seems to be that the traditional (and incumbent) corporate reporting system is still primarily aimed at the providers of capital. Other elements or reporting have been appended on to this system e.g. environmental reporting, rather than the full reporting system itself called into question. You may ask why change what is currently there. I’m not sure this is the definite answer, but changes in technology, the business environment and business risk (to mention but a few) have been arguably more drastic in the past 20 years than the previous 100 years.
The report argues that a new corporate reporting systems needs to have six characteristics, which I summarise below. It argues that if these are incorporated within internal reporting and management processes, the external reporting will likewise improve.
- Encourage innovation and change. This should allow a reporting system to respond effectively to shifts in the business environment.
- Balance judgement and compliance i.e. go beyond compliance reporting solely. What information is needed as a basis for good decisions.
- Focus more on long-term value, by more integrated management and external reporting.
- Make reporting accessible, timely and relevant.
- Give shareholder and investors more information in long term sustainability and value creating capabilities.
- Ensure some balances and checks are incorporated into the overall reporting system and make someone responsible for this.
Preventive maintenance – a good investment?
 This article on The Economist website brought me back to my days working as a management accountant in manufacturing firms. Maintaining manufacturing and process equipment was always a delicate balance. Spares and maintenance staff pay was quite a substantial cost in one plant I worked in over the years. This plant, like others, tried its best to engage in preventive maintenance programs. This usually implied using a mixture of following guidelines from equipment manufacturers and the experience of the maintenance staff. But, as I am sure you can imagine, preventative maintenance comes at a cost too. The arguments would always be “should we wait until it breaks, or fix it before it breaks”. Of course, letting a piece of equipment go unmaintained can create serious problems. A business needs to avoid its main manufacturing process being down – losses of revenue per day (or even per hour) rack up very quickly. So from an accounting and profit view, a balance needs to be achieved between the right level of preventive maintenance and the cost of same.
Of course modern technology can help. When I left my last manufacturing role back in 2004, process equipment could be remotely diagnosed and repaired by engineers. I always remember being amazed in or around 2001 when a production manager told me how the main machine at our plant had PLC’s (programmable logic circuits) with an IP address – the same as any PC or internet device. This meant the engineers from the equipment manufacturer could simply connect over the internet. At the time I was thinking, wouldn’t it be great if fault information could be sent out instead, or even better, that fault signs might be noted in advance.
So, reading the above mentioned piece from The Economist brought me back to those great days when I as an accountant was constantly amazed by how advanced machinery had become. But now it seems a “virtual engineer” may be on hand to predict if electrical equipment is showing early signs of failure (read the piece for more detail). No detail is given on the cost of such devices, but it would seem to be a great cost-saving idea. It could mean that preventive maintenance costs are incurred less frequently as equipment may be perfectly fine beyond it’s normal maintenance period
Investors call for clearer business reporting

CIMA commented recently (see here) on an IFAC report which suggests that financial reports have become too complex with the result that the underlying financial performance of a business is hidden. Add to this the increasingly complex nature of businesses and you get some idea if the problems in compiling clear concise and meaningful reports. The IFAC report quotes Tanya Branwhite, executive director of strategy research at Macquarie Securities in Australia: ‘If financial accounts are not prepared with the users in mind, then we risk a whole area of unaudited “shadow reporting” being provided directly to investors that doesn’t go through the rigorous financial accounting process,’ she warns.
I remember from my early accounting lectures that a ‘knowledgeable’ investor in seen as the defining user of accounting reports. If you are prepared to stick your money where your mouth is, you’ll want to know all the detail. But the problem is that financial statements just can’t provide this, or as the IFAC report highlights, are too complex. According to the IFAC report, business reporting suffers from a number of significant issues at present: information overload, fair value accounting, operational performance, convergence of accounting standards, real time reporting, management commentary and sustainability reporting. The big questions is how can financial reporting help solve these? One simple answer suggested is that investors might become more actively involved in the standard setting process (i.e. IFRS) and discussions about the presentation and content of financial reports.
Spreadsheet skills: waterfall charts

The Chartered Institute of Management Accountants (CIMA) publishes a regular e-zine called Insight. One of their regular postings is Microsoft Excel tips for accountants and finance specialists. This posting (Spreadsheet skills: waterfall charts)shows how to produce a graph in Excel which shows the variation in a variables (e.g. sales, profit, output) from one period to another. Click on the link to get a full walk-through example


